edited by
406 views
0 votes
0 votes

Answer the questions based on the following graph.
The graph given below gives the yearly details of money invested in producing a certain product over the years 1991 to 1995. It also gives the profit (in ‘000 rupees).

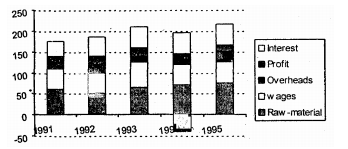
The average profit, in lakhs of rupees, over the five-year period was approximately

  1. 10
  2. 19
  3. 13
  4. 28
edited by

Please log in or register to answer this question.

Related questions

529
views
0 answers
0 votes
makhdoom ghaya asked Jun 9, 2017
529 views
Answer the questions based on the following graph.The graph given below gives the yearly details of money invested in producing a certain product over the years 1991 to 1...
369
views
0 answers
0 votes
makhdoom ghaya asked Jun 9, 2017
369 views
Answer the questions based on the following graph.The graph given below gives the yearly details of money invested in producing a certain product over the years 1991 to 1...
507
views
0 answers
0 votes
makhdoom ghaya asked Jun 9, 2017
507 views
Answer the questions based on the following graph.The graph given below gives the yearly details of money invested in producing a certain product over the years 1991 to 1...
378
views
0 answers
0 votes
makhdoom ghaya asked Jun 9, 2017
378 views
Answer the questions based on the following graph.The graph given below gives the yearly details of money invested in producing a certain product over the years 1991 to 1...
478
views
0 answers
0 votes
makhdoom ghaya asked Jun 9, 2017
478 views
Answer the questions based on the following graph.The graph given below gives the yearly details of money invested in producing a certain product over the years 1991 to 1...